The PDF file that you get for each submitted form now includes a snapshot of each chart, map and linked image. We provide responsive design for charts, images and maps. There is conditional formatting with 3-color scale and data bars.
And there is a new ThemePreview toolbar that allows you to test variations of a theme directly in the web browser.
SpreadsheetConverter offers a fee-based Advanced Submit Service to help users collect electronic forms. The submitted form is directly delivered to the Inbox of the form owner along with the form contents encoded in PDF and CSV files. In version 9.3 we have worked on getting also advanced data types like charts, images and maps into the PDF file.
Any Interactive Chart is now included in the PDF file as a static image of the chart as it appeared in the form when the form was submitted.
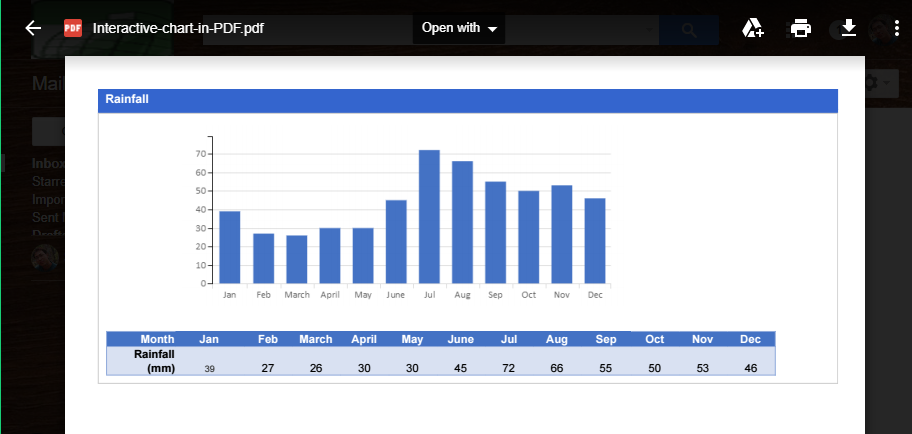
To get better output in the PDF, please put the chart in a single big cell, e.g. by merging all the cells that the chart covers.
Any Google Map in the form is now also included in the PDF as a clickable image. Click on the image to get to the interactive version of the Google Map with the exact center location and zoom level from when the form was submitted. Only the center marker is present in the PDF file. If you have additional markers in a Google Map they will not be included.
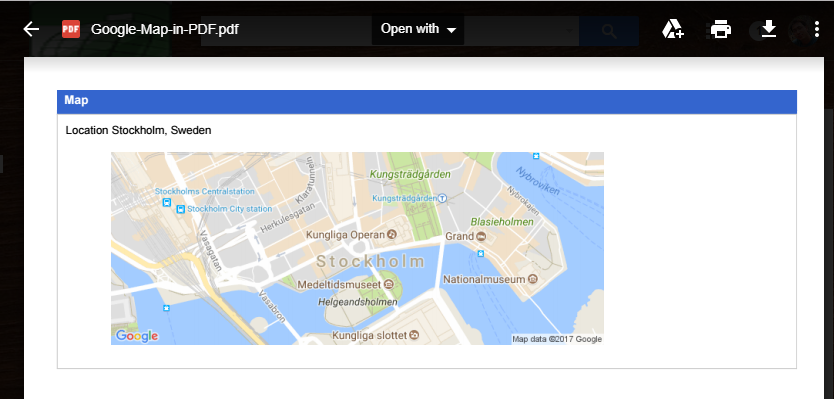
For this to work, the Google Static Map API must be enabled for your Google account. Please read our tutorial about how to obtain a Google API key. There are also instructions on how to verify that the Google API key is properly set up for use with SpreadsheetConverter.
With the free quota, you can use map sizes up to 640 x 640 pixels.
The PDF file now includes the image that was selected by each Link Image widget in a form. We may need to reduce the size of the image to make it fit the PDF. Click on the image to see the image in full size.
The PDF file contains the names of all files added with the File Attachment widget for the submitted form.
If your form contains hidden rows or sheets, these are now also hidden in the PDF file.
More and more web users have small devices with narrow screens. When you create web pages, you must ensure that these can be easily viewed also on mobile devices. Otherwise, your calculator may become difficult to understand or use for some of your most important visitors.
SpreadsheetConverter supports industry-standard responsive web design, a methodology that automatically optimizes the layout of a web page for each screen. In the example below, the web design responds to the screen width by showing six column on a desktop, three on a tablet but there is only room for two columns on the narrow smartphone screen.

Most spreadsheets have historically been very wide, which makes them difficult to use on smaller devices with narrow screens. The wide layout requires a lot of horizontal scrolling. With other solutions you may have to create a separate “mobile” version of each spreadsheet. With SpreadsheetConverter you can instead easily divide the spreadsheet into responsive blocks that flow naturally across the screen regardless of what device is being used.
With version 9.3 you can use Interactive charts, Images and Google Maps as separate Responsive Blocks.
To see this in action on a laptop, open the Responsive Chart demo and resize the browser window to see the effect on the page layout.
To view the demo on your mobile device, scan the QR code below.

For maps, open the Responsive Google Map demo from your laptop and resize the browser window to see the effect on the page layout.
To view the demo on your mobile device, scan the QR code below.

When you use graphical items like charts, maps and some of the widgets, it is easy to just drag the placeholder to the right spot on the sheet. In many cases the resulting web page will look fine anyway. This is thanks to Excel’s graphical layers, that allow you to position stuff freely on top of a spreadsheet.
Don’t just float the chart on top of the worksheet. As you can see in the screenshot below, the chart is not properly enclosed in a single cell.
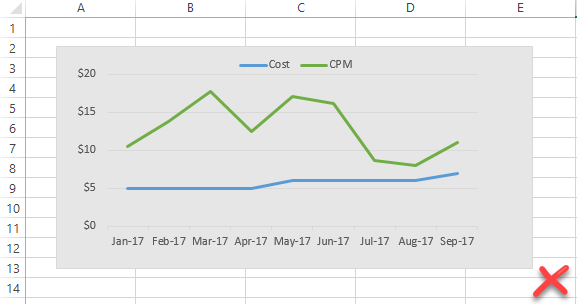
With responsive design, it may be difficult to place a chart or map in exactly the right position on the web page just based on where you put the placeholder in the graphical layer. To ensure a correct result with responsive design, always place charts, maps and graphical widgets in their own cell.
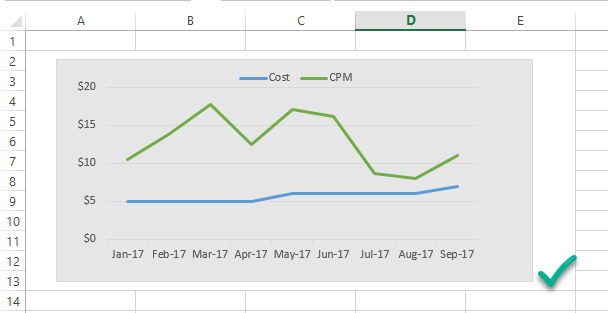
Do merge cells to make room for each chart or map. In the screenshot below, the cells A2:E13 have been merged to become a much more reliable home for the chart.
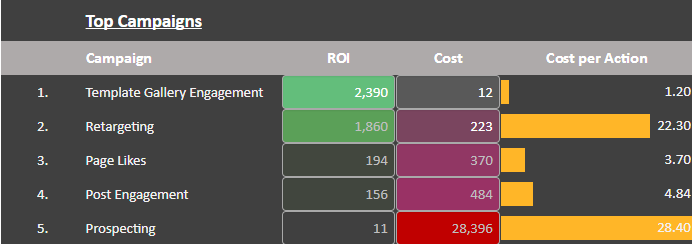
Version 9.3 extends conditional formatting by supporting all condition types such as Number, Percent, Formula and Percentile of 2-color scale and adding support for 3-color scale. We’ve added basic support for Data bar too. So, now it is even easier to present your numbers in a colorful and appealing way.
SpreadsheetConverter uses visual themes to control some of the layout and design aspects of the converted web page. The new Theme Preview toolbar let’s you tamper with some of these settings directly in the web browser. You can apply different themes, test the Material design, center the page on the screen and change the width of the web page.
The video below shows a few examples of what you can do.
Your changes to the settings are saved automatically with the converted web page. If you upload the page to the web it will use your most recent settings.
If you convert the same spreadsheet again, remember to first apply the theme you decided on. After conversion you will have to open Theme Preview again to reapply any other settings.
Theme Preview is currently supported in the HTML flavor only. Support for Node.js is being developed.
The WEBSERVICE(url) function in Excel is partially supported. This means you can get JSON results from external web services and use them in your calculations.
Here is a demo that fetches exchange rates from fixer.io and manually parses the returned JSON values through the use of MID, LEN etc functions. Currently, there is no function available to filter the JSON result in Excel.
This update is free to all version 9 users – just download and install the latest version of the program. If you are using version 8 or earlier, you must first upgrade to the latest version.
If you need help, don’t hesitate to contact our Help Desk.
Did you miss the introduction of version 9?