
Rolling dice example
If we roll a die 20 times, how many times of each outcome 1,2,3,4,5,6 do we get? We know that if we repeat the experiment forever, the number of 1,2,3,4,5,6 will be equal, but whenever you play a game like Monopoly, Risk or Settlers, you know that this isn’t the case.
This is an example of what you can do with SpreadsheetConverter, a clever program that lets you publish your Excel spreadsheets on the web. Send us one of your own spreadsheets and we’ll convert it to a web page for you, for free!
Visualizing probability online on a web page using SpreadsheetConverter with it’s chart support is easy. In this example we use bar charts and column charts to visualize the outcome of rolling dice.
The following spreadsheet shows the outcome of rolling ONE DIE 20 times using a histogram. Click on the image to open the calculator. Click on the Excel icon to download the Microsoft Excel spreadsheet used by SpreadsheetConverter to generate the webpage.
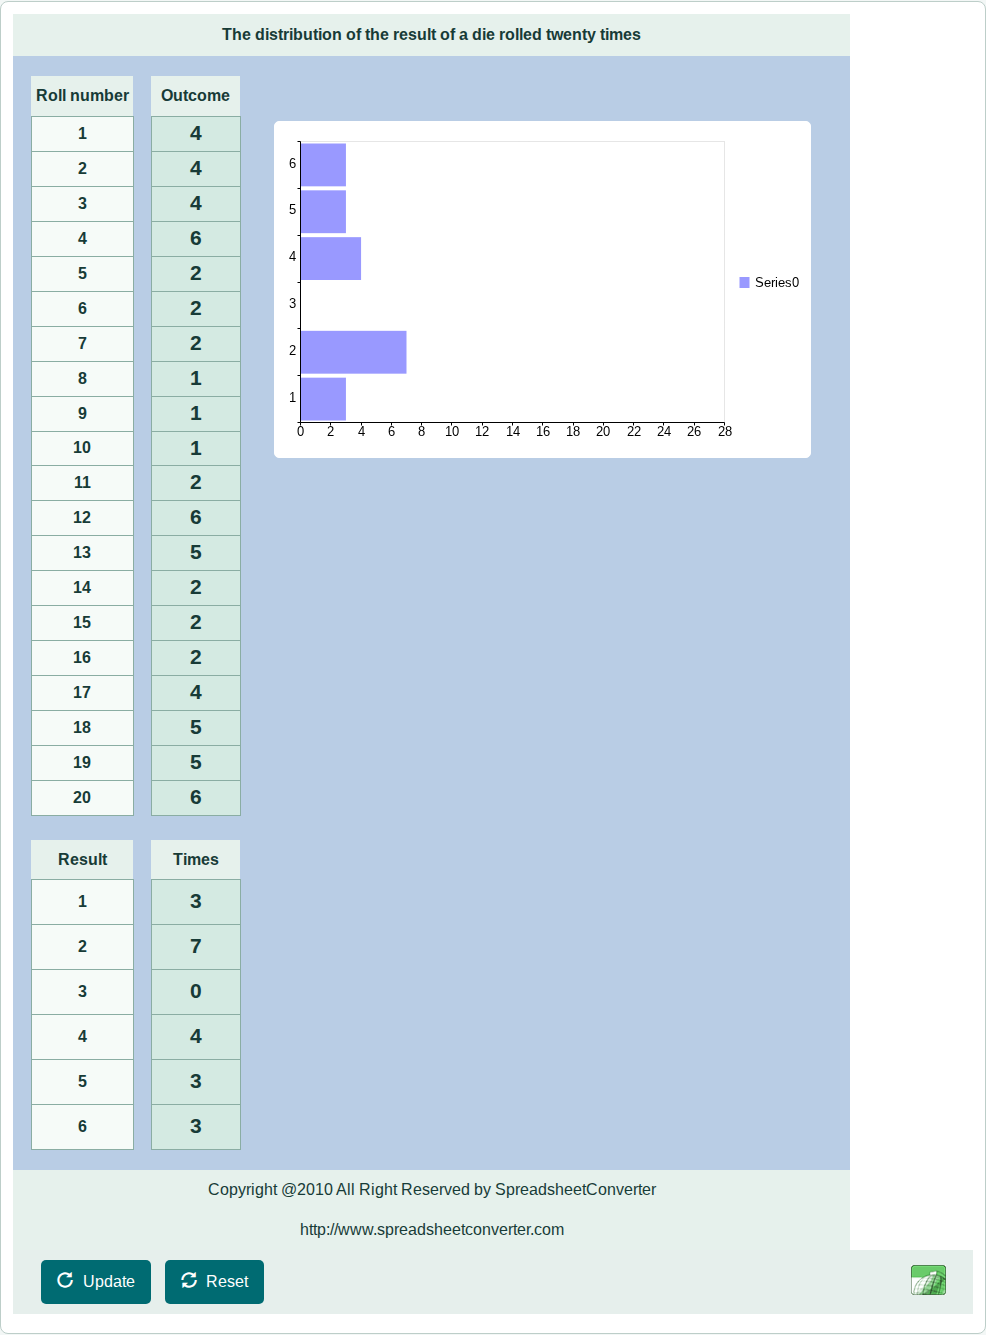

Excel spreadsheet for rolling a single die
The following spreadsheet shows the outcome of rolling A PAIR OF DICE 20 times using a histogram. Click on the image to open the calculator. Click on the Excel icon to download the Microsoft Excel spreadsheet used by SpreadsheetConverter to generate the webpage.
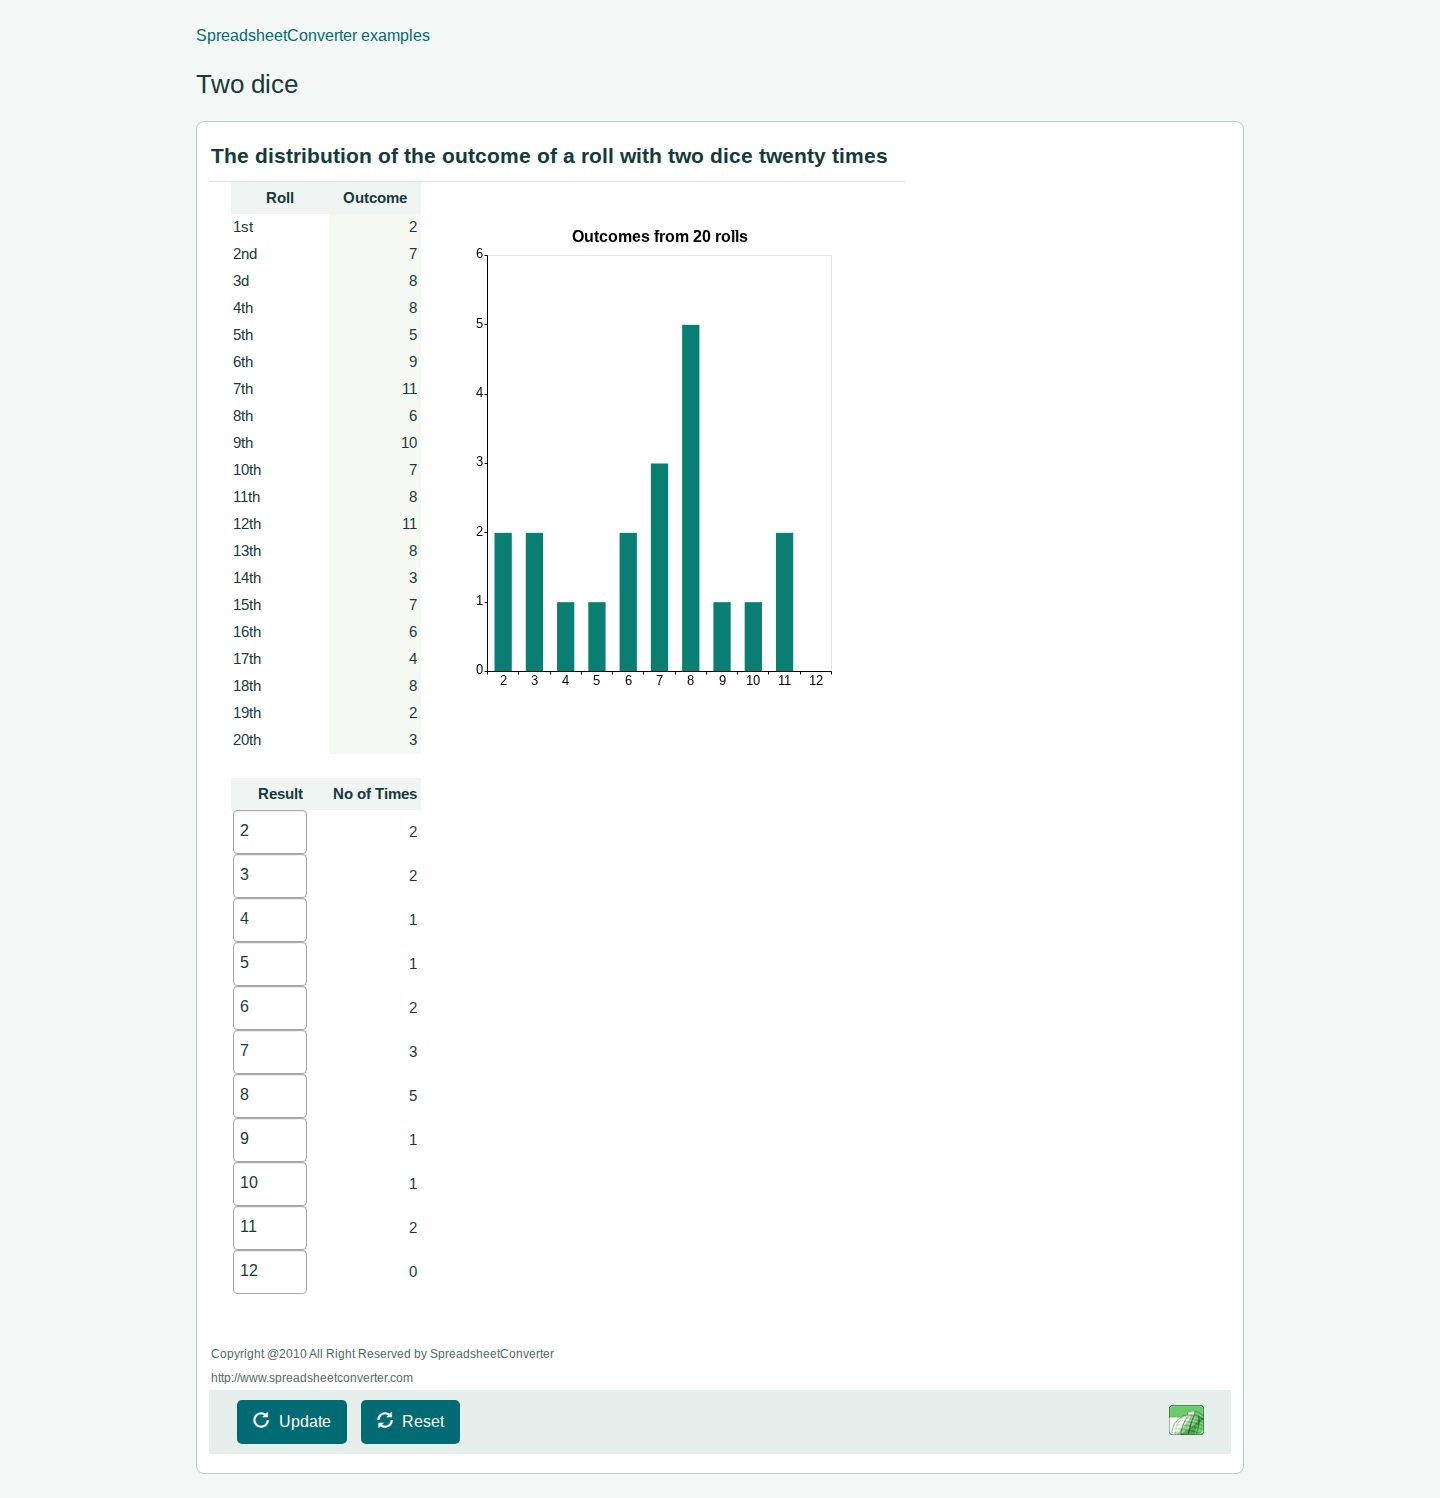
Excel spreadsheet for rolling a pair of dice
Risk
Settlers of Catan
Dice Odds for Settlers of Catan, pair of dice
Monopoly
Get started with version 12
Install SpreadsheetConverter from Excel, or find downloads and instructions for earlier versions.